Carving a Mark: A Decade of Dedication on My 10-Year Working Anniversary
Embark on a journey of self-reflection as I commemorate a decade of dedication and mark my 10-year working anniversary in the AU/NZ healthcare industry. From the thrill of overcoming challenges to the joy of achieving milestones, I have passionately driven myself to make a meaningful impact in data science.

The Nitty-Gritty of Retail Product Velocity and ROS/SPPD Metrics
This article aims to explain the concept of product velocity and its importance in the retail industry. Product velocity is a metric that measures the rate of sales of a product within a specific store and is crucial for monitoring sales performance and creating effective sales strategies. The article discusses the interplay between velocity and distribution, and how retailers rely on velocity as a principal metric when allocating limited shelf space. It also explains how product velocity can determine a product’s success or failure in the retail industry. The article concludes by introducing two key product velocity measures used by business analysts: Rate of Sales (ROS) and Sales per Point of Distribution (SPPD).

ChatGPT Prompt Optimization Guide
Optimizing the prompt input is important because it helps ensure that the model produces accurate and relevant responses. A well-optimized prompt includes relevant keywords and phrases that the model can use to generate the most appropriate response.
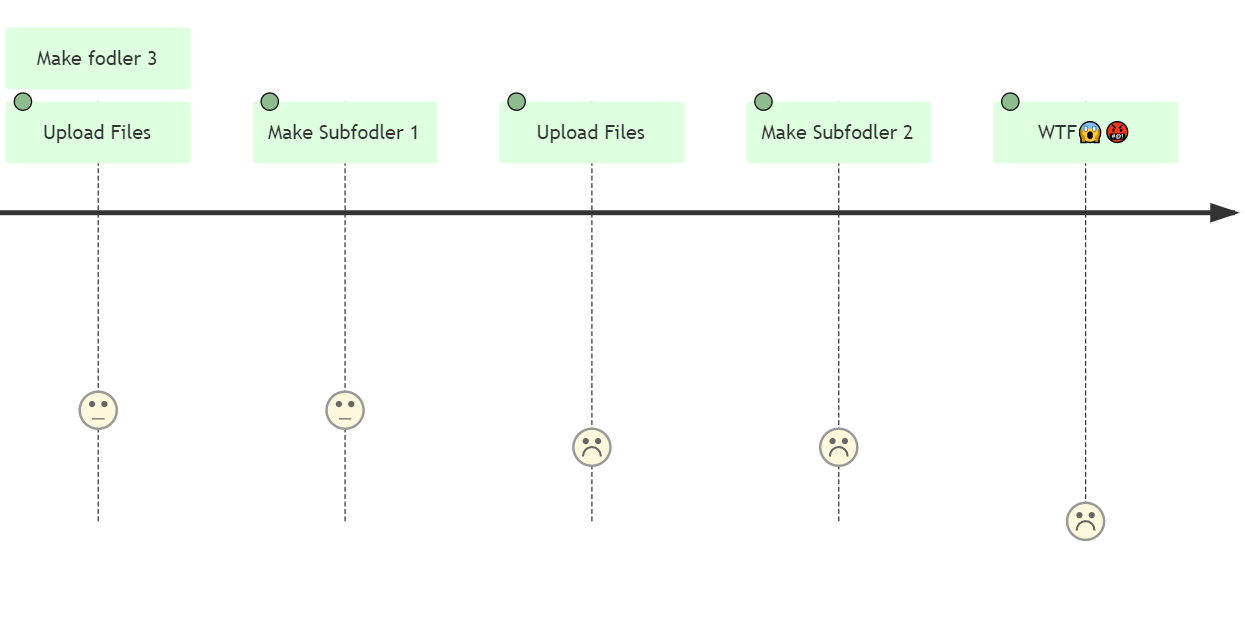
Using Python ftppretty and pathlib Libraries to upload a Nested Local Folder to an FTP Site
Normally, an FTP client app can only upload files under one folder on the FTP site at a time. This is extremely cumbersome! This utility is used to upload an entire nested hierarchical local directory to an FTP site in one go.

Fun with Complex Quadratic Polynomial Julia Set by Using Julia Programing
A Julia set is an area boundary formed by points in the complex number plane or the Riemann sphere
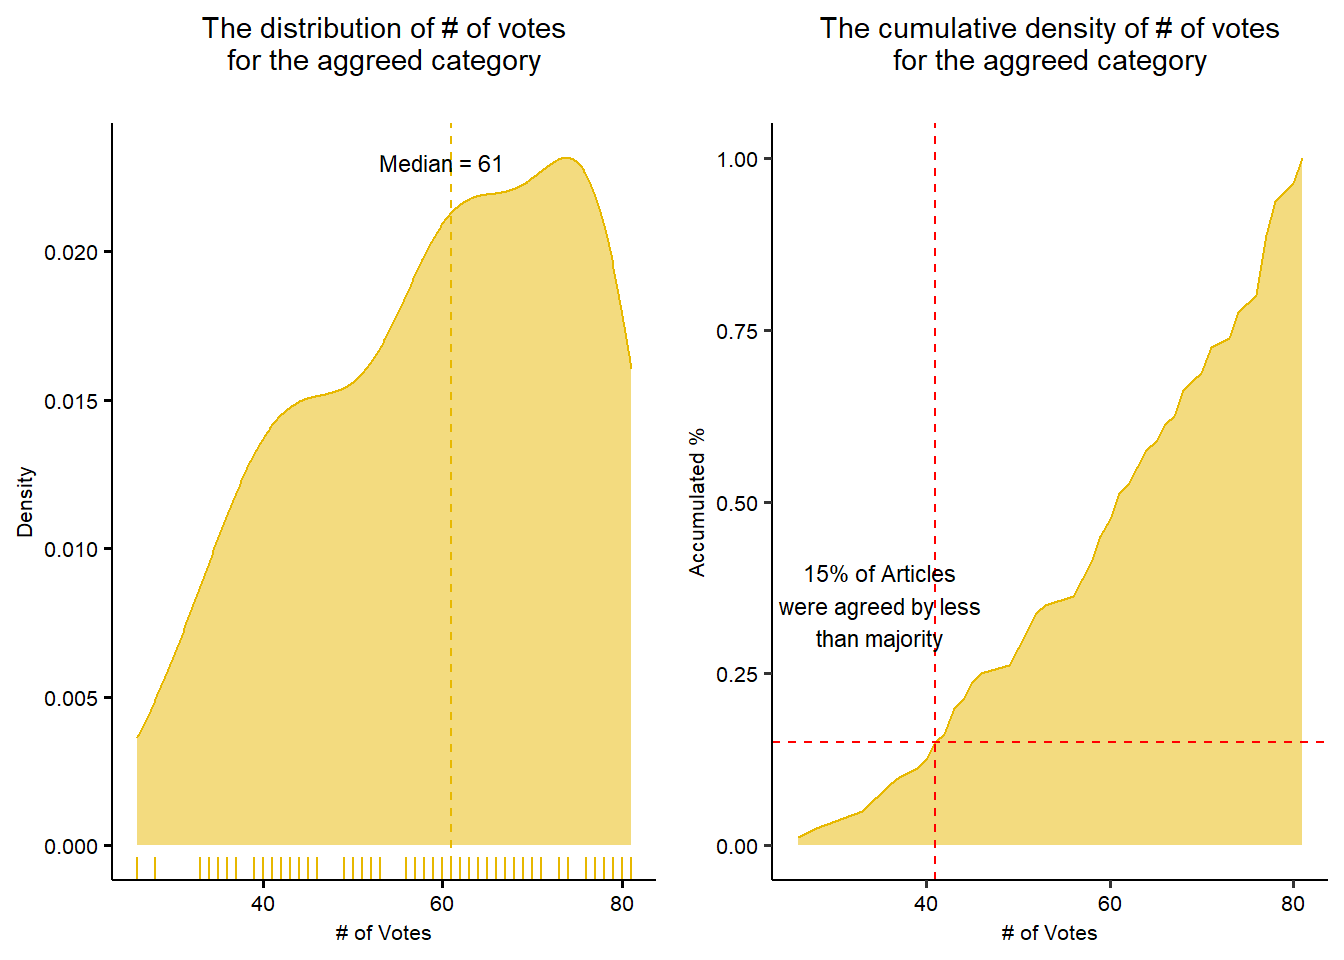
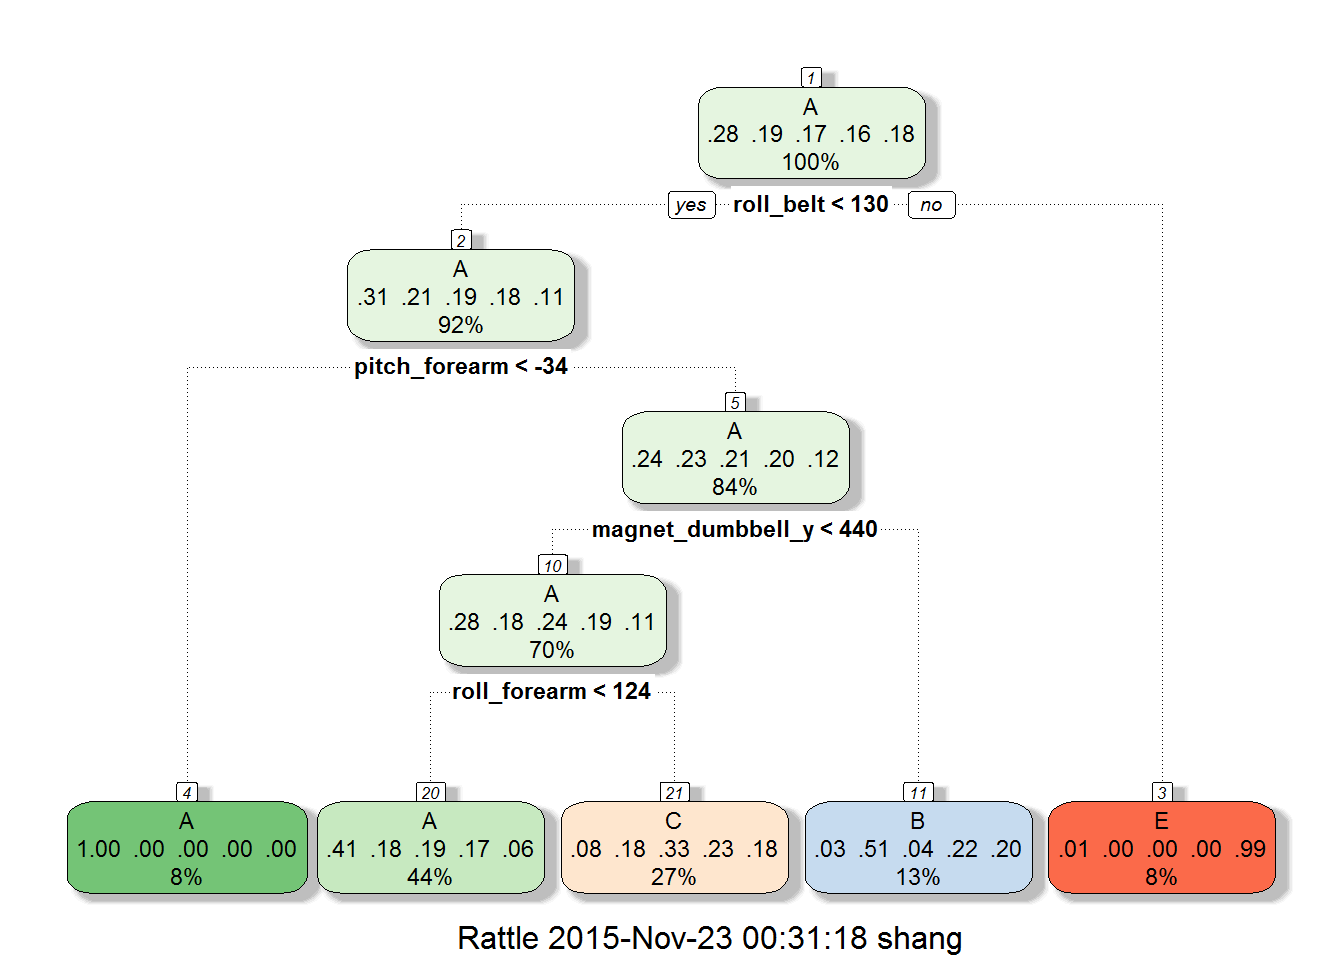
Inter Rater Reliability Study with Cohen’s Kappa and Fleiss’ Kappa
This report is a study on the inter-rater reliability analysis based on the manual annotation of 80 different articles by 81 different raters who participated this online rating exercise.
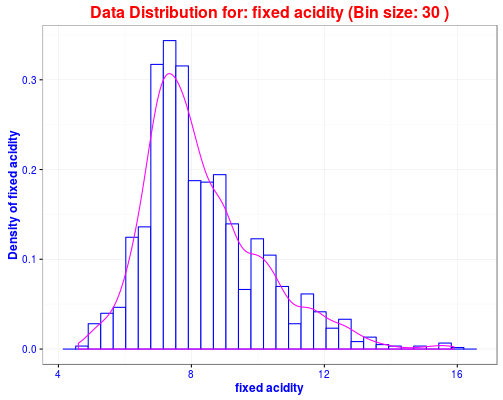
Using Shiny Server to Deploy Interactive Visualization Part 1: Data Exploratory Analysis of Red Wine Data
This Red Wine Quality data exploratory app demonstrates a core feature of Shiny: interactivity and reactivity.
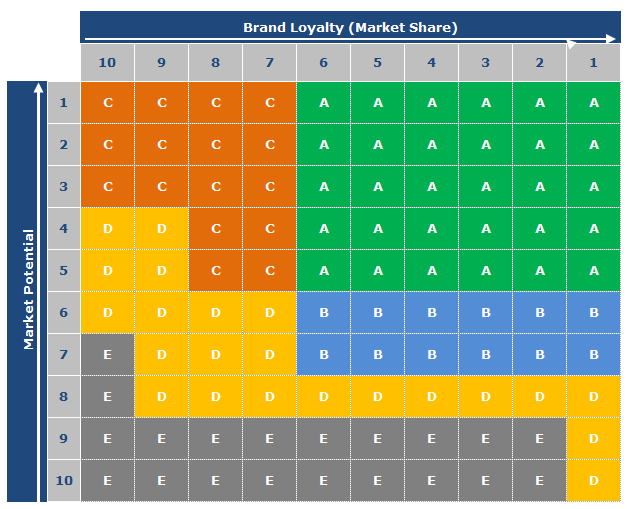
A Simple Way of Quantiling Process in T-SQL by using Window Function and Ceiling Function
Quantiling process is very powerful when 2 dimensional of sales data is available, like product sales and market sales. In business it is very common to use quantile matrix to perform the account segmentation.