August 5, 2022 at 4:39 PM
—
Steven Wang
6104825f-99e4-4156-9143-1a1cc05b9d0b|0|.0|96d5b379-7e1d-4dac-a6ba-1e50db561b04
Posted in:
Tags:
May 21, 2018 at 8:00 AM
—
Administrator

If you see this post it means that BlogEngine.NET is running and the hard part of creating your own blog is done. There is only a few things left to do.
Write Permissions
To be able to log in, write posts and customize blog, you need to enable write permissions on the App_Data and Custom folders. If your blog is hosted at a hosting provider, you can either log into your account’s admin page or call the support.
If you wish to use a database to store your blog data, we still encourage you to enable this write access for an images you may wish to store for your blog posts. If you are interested in using Microsoft SQL Server, MySQL, SQL CE, or other databases, please see the BlogEngine docs to get started.
Security
When you`ve got write permissions set, you need to change the username and password. Find the sign-in link located either at the bottom or top of the page depending on your current theme and click it. Now enter "admin" in both the username and password fields and click the button. You will now see an admin menu appear. It has a link to the "Users" admin page. From there you can change password, create new users and set roles and permissions. Passwords are hashed by default so you better configure email in settings for password recovery to work or learn how to do it manually.
Configuration and Profile
Now that you have your blog secured, take a look through the settings and give your new blog a title. BlogEngine.NET is set up to take full advantage of many semantic formats and technologies such as FOAF, SIOC and APML. It means that the content stored in your BlogEngine.NET installation will be fully portable and auto-discoverable. Be sure to fill in your author profile to take better advantage of this.
Themes and Plugins
One last thing to consider is customizing the look and behavior of your blog. We have themes and plugins available right out of the box. You can install more right from admin panel under Custom. Also you can check out our high quality themes.
On the web
You can find news, tutorials, documentation, tips and tricks about BlogEngine.NET on the official website. The ongoing development of BlogEngine.NET can be followed at Github.
Good luck and happy writing.
The BlogEngine.NET team
f39c3289-e861-48f7-a4b7-edaaffe6f6dc|0|.0|96d5b379-7e1d-4dac-a6ba-1e50db561b04
Posted in:
Tags: Blogging, welcome
April 23, 2018 at 2:43 PM
—
Steven Wang
dbf808ad-dd36-497c-92f0-a9058218a759|0|.0|96d5b379-7e1d-4dac-a6ba-1e50db561b04
Posted in: NLP
Tags:
February 5, 2016 at 9:11 PM
—
Steven Wang
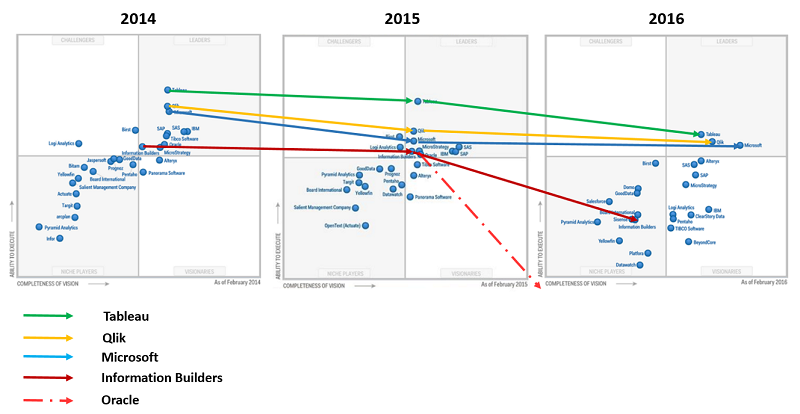
Comparing to past 2 years, the latest published Gartner Magic Quadrant for Business Intelligence and Analytics Platforms has some very interesting changes.
There are only 3 big players stay in the first group: Tableau, Qlik and Microsoft. Given that the MS did a fantastic job on the new Power BI platform, I'm not surprising MS is waken up and rising in this space. I was surprised that Microstrategy, IBM, SAP and Information Builders are fallen out the first group. Particularly, Oracle is dropped off the radar.
This is getting more and more interesting and look forward to how all these players doing this year.
537a0719-c887-47e3-bb22-0e96a94791b7|1|5.0|96d5b379-7e1d-4dac-a6ba-1e50db561b04
Posted in:
Tags:
February 3, 2016 at 4:11 AM
—
Steven Wang
f48d161b-5d07-471c-b95f-1a86a403d601|1|5.0|96d5b379-7e1d-4dac-a6ba-1e50db561b04
Posted in:
Tags:
January 8, 2016 at 11:55 PM
—
Steven Wang
Slidify is an R package helps to create
and publish beautiful HTML5 presentations from RMarkdown. Slidify package is
fantastic for creating reproducible presentations.
slidifyLibraries
contains external resources used by Slidify.
rCharts is an
R package to create, customize and publish interactive javascript
visualizations from R using a familiar lattice style plotting interface.
All of these
three packages are created and maintained by Ramnath
Vaidyanathan of McGill University. Since all
these three packages are not on CRAN and needs to be installed from github using the Hadley's devtools package.
library(devtools)
install_github('ramnathv/slidify')
install_github('ramnathv/slidifyLibraries')
install_github('ramnathv/rCharts')
As Ramnath mentioned in one of this
Slidify workshop, While the installation process from github is
relatively painless for Mac/Linux/Ubuntu users, for the windows users it
is not that luck. I have to confess that when I used the above code to install
these packages it caused a chaos for me. Not only that the package was not
installed properly but also some other installed packages were broken!!!
Thiago Silva’s post Installing Slidify on a Windows
Machine has provided his advice on how he successfully made a workaround. I
will give a step by step guide on top of his blog, which I have successfully
installed these 3 packages in window 7 and windows 10 machines.
1.
Download packages zip files
a.
Download slidify zip file from Github
b.
Download slidifyLibraries zip file from Github
c.
Download rCharts zip file from Github
2.
Put zip files into a folder, say, c:/packages
3.
Unzip packages and you will notice that all
packages have a “-master” suffix in the folder name. “-master’ will need to be
removed as below:

4.
Now we will use the build utility from
dvtools package to convert a package source directory into a single bundled
file. If set binary = FALSE, this creates a tar.gz package that can be
installed on any platform, provided they have a full development environment. Now
we will use the below code to build packages:
build("C:/packages/slidify/",
binary=FALSE) # Change C:/packages/ to your folder name
build("C:/packages/slidifyLibraries/",
binary=FALSE) # Change C:/packages/ to your folder name
build("C:/packages/rCharts/",
binary=FALSE) # Change C:/packages/ to your folder name
5.
Once packages are built successfully, we use
the below code or alternatively we can use the RStudio to install these
packages:
a.
R Script code:
# Change C:/packages/ to your folder name
install.packages("C:/packages/slidify_0.5.tar.gz",
repos = NULL, type="source")
# Change C:/packages/ to your folder name
install.packages("C:/packages/slidifyLibraries_0.3.1.tar.gz",
repos = NULL, type="source")
# Change C:/packages/ to your folder name
install.packages("C:/packages/rCharts_0.4.5.tar.gz",
repos = NULL, type="source")
b.
Install from RStudio, go to manu: Tools,
Install Packages… as below:

This has
successfully installed these three packages: sidify, slidifyLibraries, and
rCharts in windows environment.
I hope this
helps and thanks for reading.
December 11, 2015 at 6:35 AM
—
Steven Wang
In business analysis, it is very common to break sales into different
quantile groups and then it can be used for segmentation purpose. The most
commonly used quantiles are:
- Quintiles which creates 5 equal size groups
- Deciles which creates 10 equal size groups
Occasionally, Ventiles (20 groups) and Percentiles (100
groups) will used.
Quantiling process is very powerful when 2 dimensional of
sales data is available, like product sales and market sales. In business it is
very common to use quantile matrix to perform the account segmentation. An example
of segmentation definition can be based on a 2 X 2 deciling matrix like below:

Even this is a very common process, it is indeed not a straightforward
simple calculation to get quantile values in SQL server. There are many ways we
can do to calculate such, but I found that use window function in conjunction
with CEILING function is the easiest way to calculate quantile value. Let’s try. I
will use a deciling process to start with.
The first step to calculate decile value for a specific
object (Account, Product etc) is to calculate cumulative values and then
calculate the cumulative percentage.

This will generate the cumulative product sales value and its cumulative percentage. the top 10 records as below:

Now the question is how can we assign a decile value based on the cumulative percentage value? there are many ways to do it. But as I found that there is a very simple way to do it by using SQL CEILING function:

You can randomly check the results:

Based on this deciling calculation, we can generalize the quantiling calculation on any quantile number between 1 and 100.

I hope this tip is useful and please see the attached scripts if you want to have a try.
Thanks.
Quantile_Calculation_Script.sql (1KB)
e522b4af-c055-4479-a2e3-cea012e66ac8|0|.0|96d5b379-7e1d-4dac-a6ba-1e50db561b04
Posted in: T-SQL | Window Functions
Tags:
November 24, 2015 at 2:45 AM
—
Steven Wang
March 18, 2015 at 2:19 AM
—
Steven Wang
Power View Report embedded view is indeed a very nice feature and opens up a big opportunities for ISVs and companies and individuals to share data and visualizations. Please check this blog, Embed Power View Interactive Reports in Your Blogs and Websites, for more details about how to embed a power view report.
While this is great news, I also found that there are some frustrations. The embedded view is rendered nicely in IE 9 but there are issues with IE 11 and other main browsers.
I have put together a few mains issues I found. If you have same issue and different issue please share your experience with me. Thanks.


May 8, 2013 at 3:49 PM
—
Steven Wang
In the SQL Server 2012 reporting service server event log, you might have these 2 errors:
1. Report Server cannot load the SQLPDW Extension
2. Report Server cannot load the TERADATA Extension
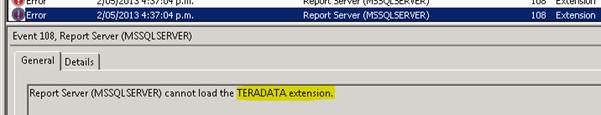
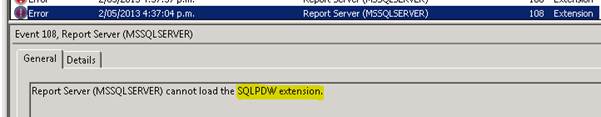
While you are not using the TERADATA/SQLPDW functionalities in your report, basically you can ignore these errors. This is because by default TERADATA and SQLPDW data extension is turned on in the reporting server configuration file.
Even you are not using the TERADATA/SQLPDW functionalities, it is still good idea to suppress the error logged into the event log.
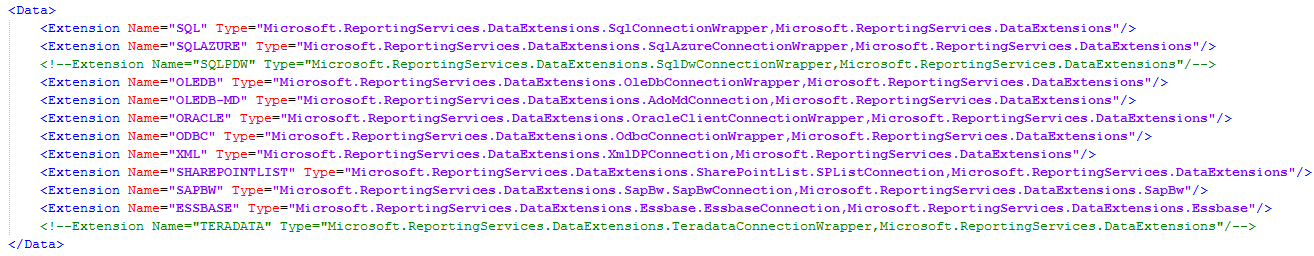
Open the reporting service configuration file rsreportserver.config under your SSRS installation folder. If you installed SSRS 2012 by default, the file will be under:
C:\Program Files\Microsoft SQL Server\MSRS11.MSSQLSERVER\Reporting Services\ReportServer\
If you locate the Data Section you will see the below yellow highlighted data extension TERADATA and SQLPDW is turned on.
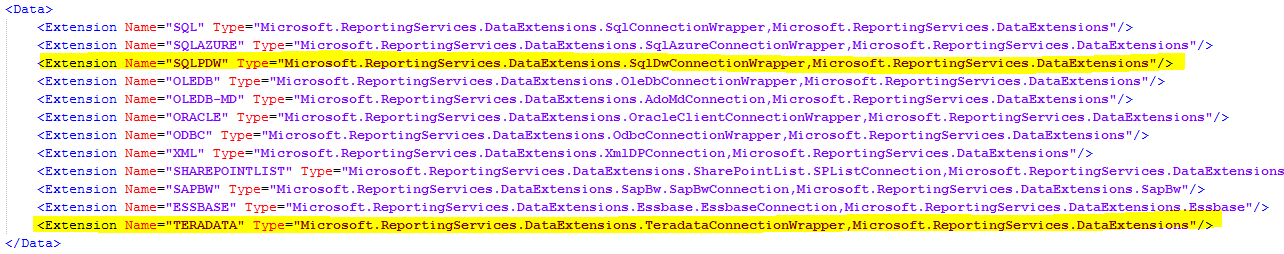
If you comment out these 2 extensions as below and save, those error messages will no longer be generated.